The Statistics section allows to review the total and average amounts of the objects processed by Dr.Web during a specified time period (see Figure 13).
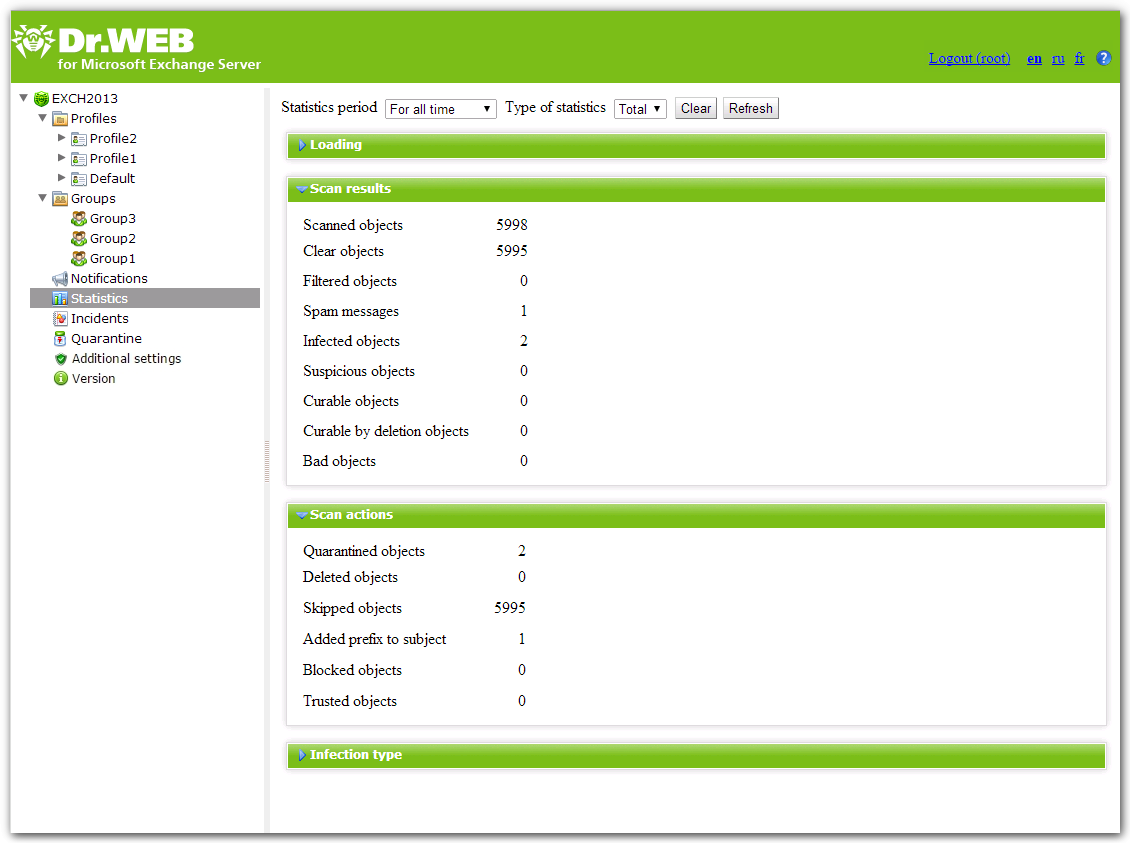
Figure 13. Statistics
To configure the statistics
1.In the Statistics period drop-down list, select the time interval to view the statistics information about. You can choose one of the following intervals:
•For all time—to view the total statistics since Dr.Web start.
•For last day—to view the statistics for the last 24 hours of Dr.Web operation.
•For last hour—to view the statistics for the last hour of Dr.Web operation.
•For last minute—to view the statistics for the last minute of Dr.Web operation.
2.In the Type of statistics drop-down list, select the information type to review. Depending on the selected time interval you can review the total or average numbers as well as the the minimum and maximum values during the specified time period.
Types of information
Depending on the selected options the Statistics pane can contain the following sections:
•Loading. This section allows to review the information on the total size of the scanned objects and on the average, minimum and maximum size of the objects scanned during the specified time period.
•Scan results. This section allows to review the total number of the scanned objects and the number of the scanned objects of different types (e.g., filtered, spam messages, suspicious objects, etc.).
•Scan actions. This section contains information on the actions applied by Dr.Web to the detected malicious objects.
•Infection type. This section contains information on different types of threats, detected by Dr.Web during the specified time period.
To refresh or clear the statistics, click Refresh or Clear.