The Incidents section allows to review all incidents related to the operation of Dr.Web (see Figure 14).
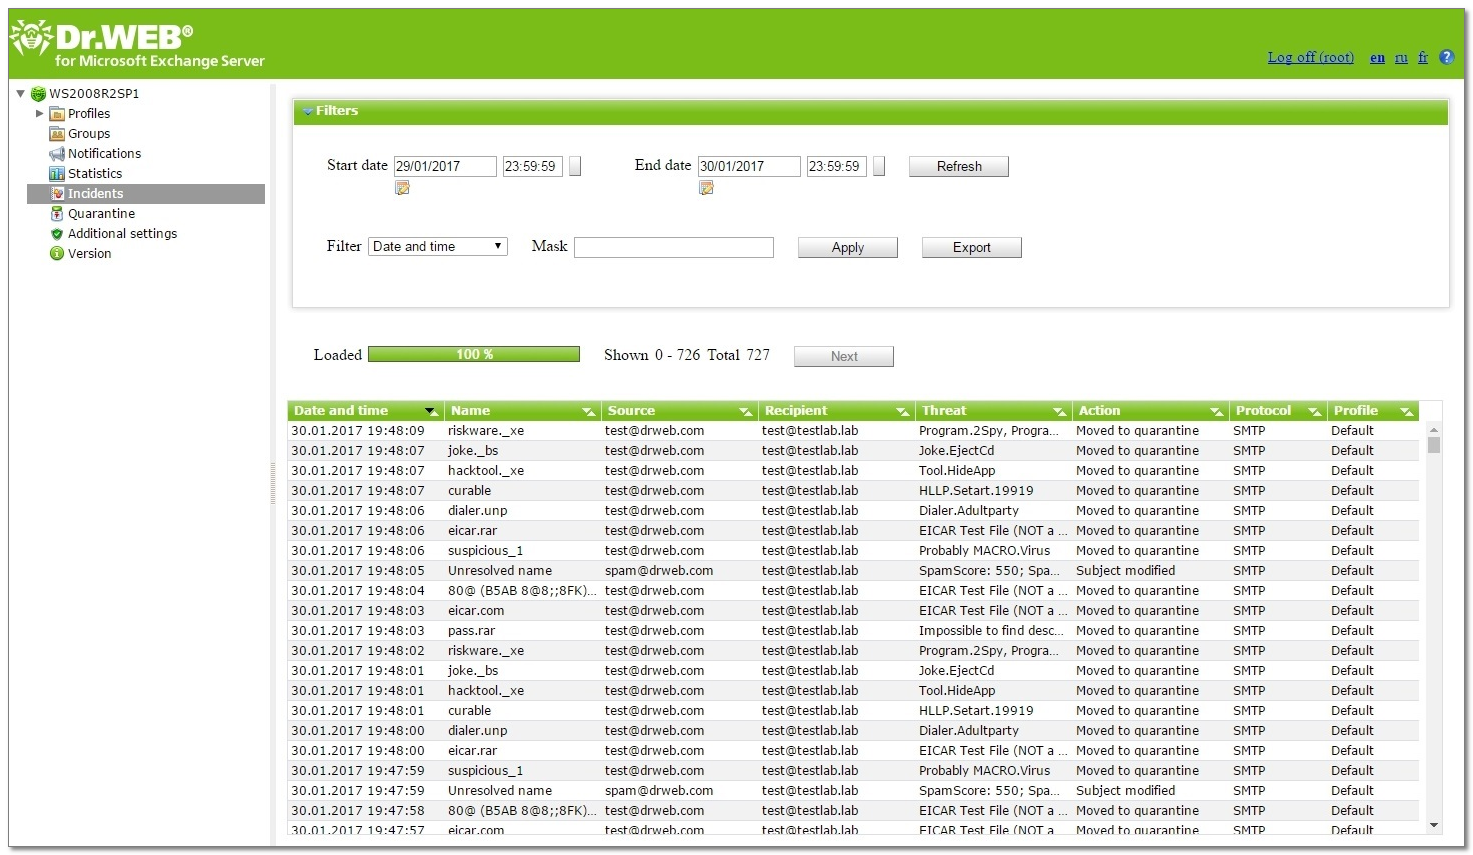
Figure 14. Incidents
To view the incidents information
For each incident in the list the following information is displayed:
•Date and time of the incident
•Name of the object related to the incident
•Email with infected object sender and recipients' addresses
•Name of the threat
•Performed action
•Protocol used to transfer the email
•Name of the applied profile
You can configure the display parameters of the incidents list:
1.Right-click the header of the list and click Select columns in the context menu.
2.Select the items to display in the list.
The page can display a limited number of list entries. If the amount of incidents exceeds this limit, you can switch to previous page to view other entries by clicking Next.
To manage the incidents list
1.You can specify the time period to review the incidents. Enter the start and the end date of the interval, then click Refresh.
2.You can use filters and filter the incidents according to certain criteria to customize the way information about them is displayed. Select the filter type in the Filter list, enter the desired value in the Mask field, then click Apply.
|
You can use the wildcard characters «*» and «?» to substitute a sequence of symbols or only one symbol. |
3.You can save the incidents list in a text file. To do this, click Export. Select the format of the file to save the incidents list, then click OK. You can use the HTML or TSV (Tab Separated Values) format.
4.To sort the incidents list according to different criteria, click the title of the corresponding column.
5.To refresh the list, click Refresh. The list of incidents is refreshed every time you open Dr.Web Administrator Web Console or the Incidents section. It may take some time to be refreshed. To stop the refreshing process, for example, if you entered wrong filtering parameters, click Cancel.