You can review the statistics on operation of the main Dr.Web components.
To open the statistics on important events of protection component operation
1.Open Dr.Web menu ![]() , then select Security Center.
, then select Security Center.
2.In the open window, select Statistics tab.
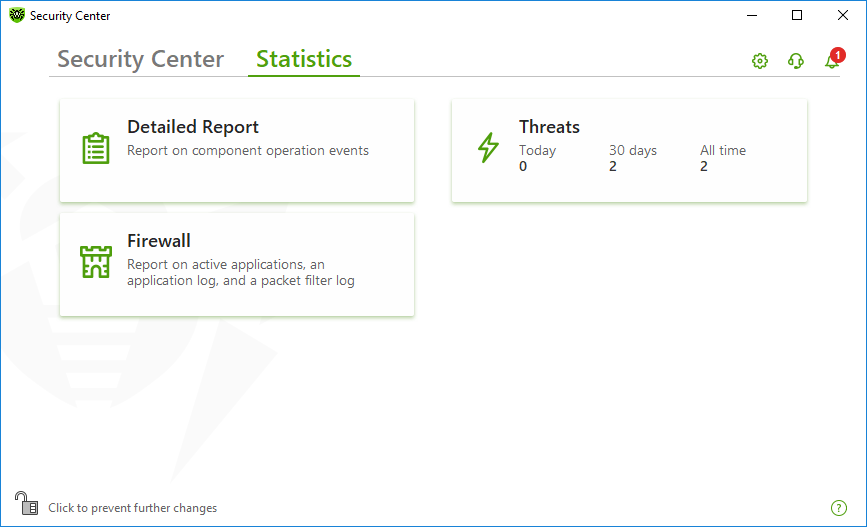
3.The Statistics page opens where reports for the following groups are available:
Figure 78. Statistics on component operation
4.Select a group to review the reports.
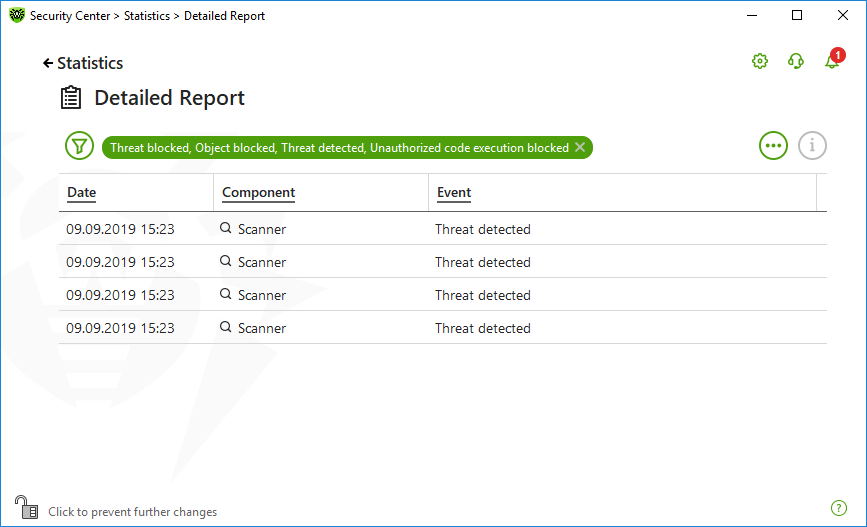
In this window, the detailed information on all the program operation events is collected.

Figure 79. Detailed report window
The following information is logged in the report:
•Date—date and time of an event.
•Component—the component or module that caused the event.
•Event—a brief description of the event.
By default, all events for all the time are displayed.
The management elements ,
,
are used to work with objects in the table.
You can use additional filters to select certain events.
On the Threats tile on the main statistics window, the information on the total number of threats for a certain period of time is shown.
When choosing this option, the Detailed Report window with predefined filters for all the threats will open.

Figure 80. Statistics on threats window
The following information is logged in the report:
•Date—date and time of the threat detection.
•Component—the component that has detected the threat.
•Event—a brief description of the event.
By default, all events for all the time are displayed.
The management elements ,
,
are used to work with objects in the table.
You can use additional filters to select certain events.
You can view the report of network activity if Dr.Web Firewall is installed on your computer.
To view information on active applications, an application log, and a packet filter log, select necessary object from the drop-down list.

Figure 81. Statistics on network activity window
The report shows the following information for every active application:
•Direction
•Operation protocol
•Local address
•Remote address
•Size of sent data packet
•Size of received data packet
You can block one of the current connections or allow previously blocked connection. For this, select a required connection and right-click. Only one option is available, depending on the connection status.
The application log shows the following information:
•Application start time
•Application name
•Application processing rule name
•Direction
•Action
•Endpoint
To enable the application logging, go to Firewall page and then open Add or Edit application rule window. For the detailed information, refer to the Application rule settings section.
Packet Filter Log shows the following information:
•Start time of data packet processing
•Direction
•Processing rule name
•Interface
•Packet data
To enable packet filter logging, go to Firewall page and then open Add or Edit packet filter rule window. For the detailed information, refer to the Rule sets for filtering packets.
When clicking at one of the columns, the events are arranged in ascending or descending order.
Filters
To view a list of only those events that correspond to specific parameters, use filters. All the reports have preset filters that are available by clicking . You can also create custom event filters.
![]() The buttons to manage table elements
The buttons to manage table elements
•Click ▫To select the predefined filter for the set period of time or the filter for the update event. ▫To save the current custom filter. It is also possible to delete previously saved custom filter. ▫To delete all the current filters. •Click ▫Copy selected—allows you to copy the selected entry (entries) to the clipboard. ▫Export selected—allows you to export the selected entry (entries) to the specified folder in .csv format. ▫Export all—allows you to export all the entries of the table to the specified folder in .csv format. ▫Delete selected—allows you to delete the selected event(s). ▫Delete all—allows you to delete all the events from the table. •Clicking the |
1.To filter by a specific parameter, click on the heading of the required column:
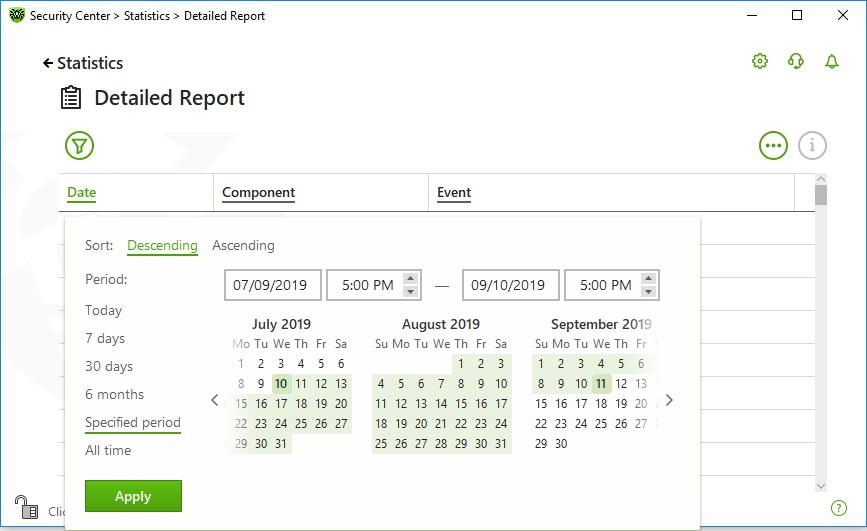
•Filter by date. You can select one of the predefined periods specified in the left part of the window, or specify your own. To set the required period, select the start date and the end date of the period in the calendar, or specify the dates in the Period field. Filtering by date is also available in ascending or descending order.

Figure 82. Data sorting
•Filter by component. You can check the components the information on which will be included in the report, or arrange the entries by ascending or descending order.
•Filter by event. You can check the events to be shown in the report, or arrange the entries by ascending or descending order.
2.Once the filter parameters selected, click Apply. Selected items will be displayed above the table.
3.To save the filter, click and select Save filter.
4.In the open window, enter a name for the new filter. Click Save.
