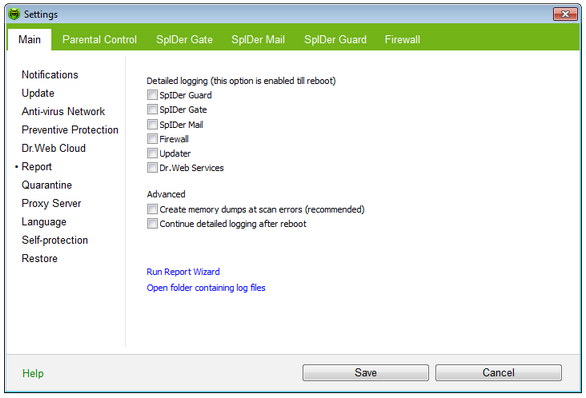
On this page, you can configure keeping records in the log files of Dr.Web components.

For details on a certain option, click a corresponding item in the picture.
To get information on options available in other pages, click the corresponding link in the picture.
By default, reports are kept in the standard mode and the following information is logged:
Component |
Information |
SpIDer Guard |
Time of updates and SpIDer Guard starts and stops, virus events, names of scanned files, names of packers and contents of scanned complex objects (archives, e-mail attachments, file containers). It is recommended to use this mode to determine the most frequent objects scanned by SpIDer Guard. If necessary, you can add these objects to the list of exclusions in order to increase computer performance. |
SpIDer Mail |
Time of updates and SpIDer Mail starts and stops, virus events, connection interception settings, names of scanned files, names of packers and contents of scanned archives. It is recommended to use this mode when testing mail interception settings. |
SpIder Gate |
Time of updates, starts and stops of SpIDer Gate, virus events, connection interception settings, names of scanned files, names of packers and contents of scanned archives. It is recommended to use this mode for reception of more detailed information on the checked up objects and work of the HTTP-watchman. |
Firewall |
Dr.Web Firewall does not log its operation in standard mode. When you enable detailed logging, Firewall collects data on network packets (pcap logs). |
Updater |
List of updated Dr.Web files and their downloading states, details on execution of auxiliary scripts, date and time of updates, details on Dr.Web components restarting after update. |
Dr.Web Services |
Information on Dr.Web components, changing of Dr.Web components settings, components starts and stops, preventive protection events, connections to anti-virus network. |
To view log files
To view log files, click on Open folder containing log files.
To enable detailed logging
|
Logging detailed data on Dr.Web operation may result in considerable log growth and increase in process load. It is recommended to use this mode only when errors occur or by request of Doctor Web Technical Support. |
| 1. | To enable detailed logging for a Dr.Web component, set the corresponding checkbox |
| 2. | By default, detailed logging mode is used before the first restart of the operating system. If it is necessary to log component activity before and after the restart, set the Продолжать вести подробные отчеты после перезагрузки checkbox. |
| 3. | Save the changes. |
|
By default, size of log files are restricted to 10 MB. |
Advanced Settings
The Create memory dumps at scan errors (recommended) option allows to save maximum of useful information on reasons behind failures of Dr.Web components. This helps Doctor Web Technical Support specialists analyze an occurred problem in detail and find a solution. It is recommended to enable this option when operational errors occur.
On this page, you can also collect data about your operating system and Dr.Web operation to report this technical information to Doctor Web Technical Support. To do this, click on Run Report Wizard.