You can enable detailed logging for one or several Dr.Web components or services.
To change operation logging settings
1.In the Log section click Edit.
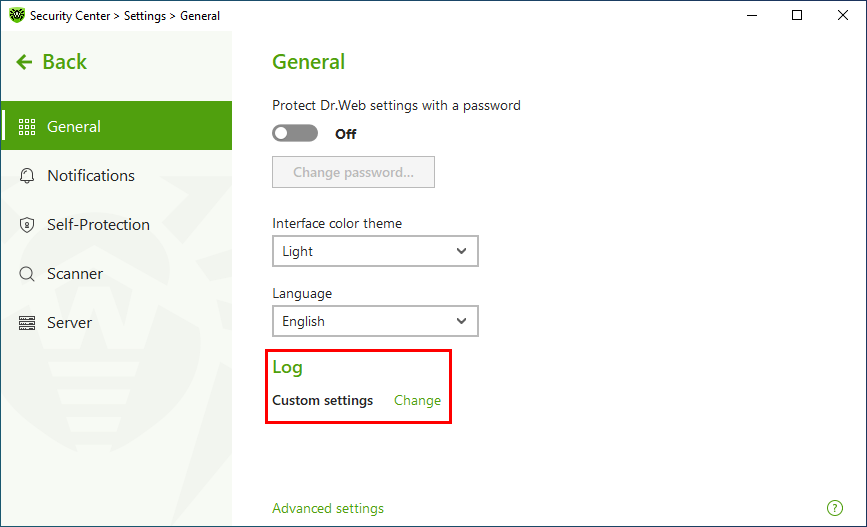
Figure 19. General Settings. Log
The window with detailed logging settings opens:
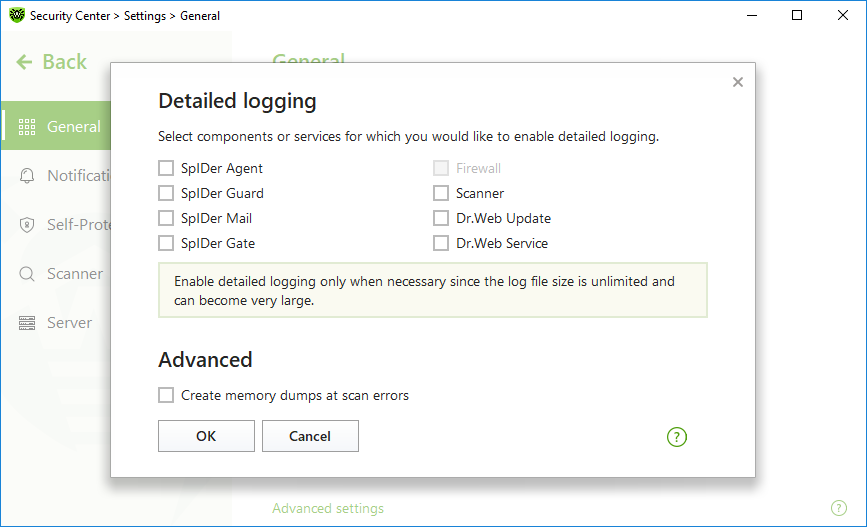
Figure 20. Operation logging settings
2.Select components, modules or services for which you would like to enable detailed logging. By default, the standard logging mode is enabled for all the Dr.Web components and the following information is logged:
Component |
Information |
|---|---|
SpIDer Agent |
Time of updates and SpIDer Agent starts and stops, detected threats, connections to centralized protection server, Dr.Web component status, error notifications, and system reboot notifications. It is recommended that you use this mode to get detailed information about the sources of errors in the program operation. |
SpIDer Guard |
Time of updates and SpIDer Guard starts and stops, detected threats, data on scanned files, names of packers, and content of scanned complex objects (archives, email attachments, file containers). It is recommended that you use this mode to determine the most frequent objects scanned by SpIDer Guard file monitor. If necessary, add these objects to the list of exclusions in order to increase computer performance. |
SpIDer Mail |
Time of updates and the mail anti-virus SpIDer Mail starts and stops, detected threats, connection interception settings, data on scanned files, names of packers, and content of scanned archives. It is recommended that you use this mode when testing mail interception settings. |
SpIDer Gate |
Time of updates, starts and stops of SpIDer Gate, detected threats, connection interception settings, names of scanned files, names of packers, and contents of scanned archives. It is recommended that you use this mode for reception of more detailed information on the checked objects and work of the internet monitor. |
Scanner |
Updates of scanning modules and virus database information, time of Scanner starts and stops, information on detected threats, names of packers, and content of scanned archives. |
Firewall |
Information and decisions on requests coming to the service, information on unknown connections with reasons for the request, and information on errors. When you enable detailed logging, the component collects data on network packets (pcap logs). |
Dr.Web Update |
List of updated Dr.Web files and their download status, date and time of updates, and details on auxiliary script execution and Dr.Web component restart. |
Dr.Web Service |
Information on Dr.Web components, changes in their settings, component starts and stops, preventive protection events, connections to centralized protection server. |
Memory dump creation
The Create memory dumps at scan errors option allows you to save useful information on operation of several Dr.Web components. This helps Doctor Web technical support specialists analyze an occurred problem in detail and find a solution. We recommend enabling this option on request of Doctor Web technical support specialists or when errors of scanning or neutralizing occur. Memory dump is saved to .dmp file located in the %PROGRAMFILES%\Common Files\Doctor Web\Scanning Engine\ folder.
Enabling detailed logging
|
When logging detailed data on Dr.Web operation is enabled, the maximum amount of information is recorded. This will result in disabling of log file size limitations and will have an impact on system and Dr.Web performance. Make sure to use this mode only when errors occur in component operation or by request of your anti-virus network administrator. |
1.To enable detailed logging for a Dr.Web component, select the corresponding check box.
2.Click OK to save the changes.
|
Log settings cannot be adjusted if the administrator of the centralized protection server to which Dr.Web is connected blocks this option.
Size of a log file is restricted to 10 MB by default (and 100 MB for SpIDer Guard). If the log file size exceeds the limit, the content is reduced to: •Specified size if the current session information does not exceed the limit. •Size of the current session if the session information exceeds the limit. |